
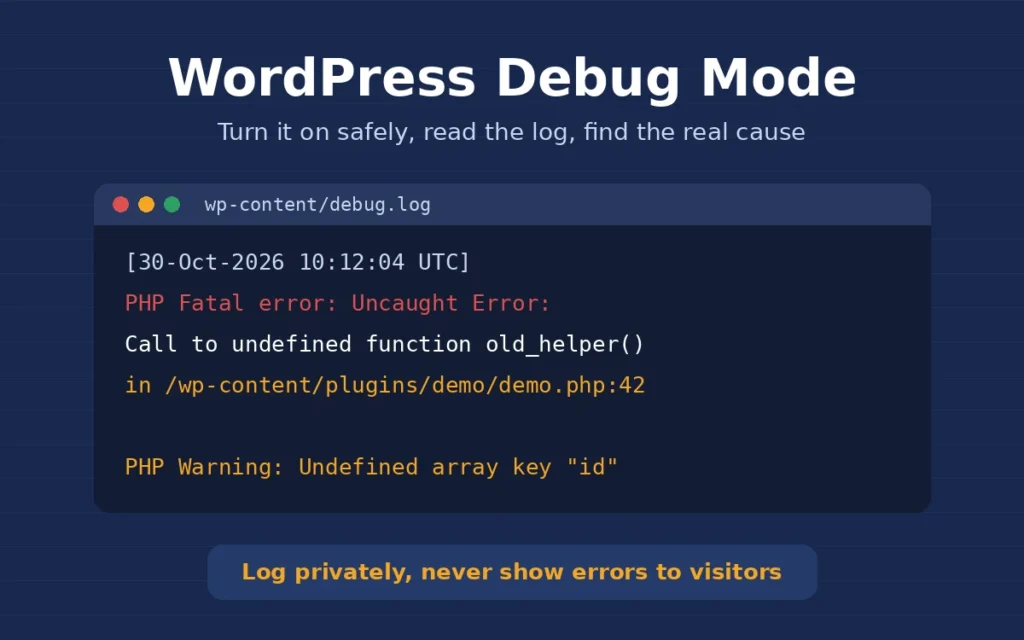
WordPress debug mode is the first thing I turn on when a client sends me a vague message like “the site is broken” or “there has been a critical error on this website”. Instead of guessing, debug mode makes WordPress write down the exact PHP error, the file it came from and the line number. In this post I share how I turn on WordPress debug mode safely, how I keep the log private, and how I read the log to find the real cause.
I am a freelance WordPress developer in Surat, and most of the error fixes I do start the same way. Five minutes with the debug log usually saves an hour of deactivating plugins one by one.
What WordPress debug mode actually does
By default, WordPress hides PHP errors. That is good for visitors, but it means a broken page often shows nothing useful, just a blank screen or a generic error message. WordPress debug mode switches PHP error reporting back on, so warnings, notices and fatal errors are recorded instead of hidden.
On its own, though, debug mode prints errors straight onto the page, where visitors and bots can see file paths from your server. That is why I never use it with the default settings on a live site. I combine it with logging to a file and turn the on-screen display off.
The WordPress debug mode settings I use in wp-config.php
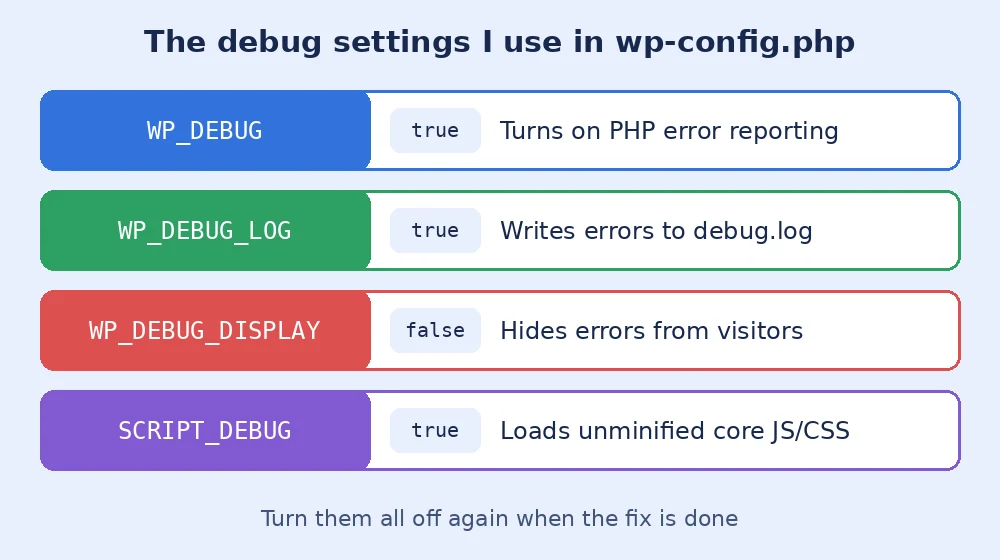
All the settings live in the wp-config.php file in the site root. I open it over SFTP or the hosting file manager, make a copy first, and add these lines above the line that says /* That's all, stop editing! */:
define( 'WP_DEBUG', true );
define( 'WP_DEBUG_LOG', true );
define( 'WP_DEBUG_DISPLAY', false );
@ini_set( 'display_errors', 0 );
If WP_DEBUG is already defined as false further up the file, I change that line rather than adding a second one, because defining the same constant twice causes its own warning. When I am chasing a JavaScript or styling problem in core files, I also add define( 'SCRIPT_DEBUG', true ); so WordPress loads the unminified versions. The official Debugging in WordPress guide lists every option if you want the full details.
Keeping the debug log private
With WP_DEBUG_LOG set to true, errors are written to wp-content/debug.log. The problem is that this location is public on many servers, so anyone who guesses the URL can read it. On live sites I give the log a custom path outside the public folder instead:
define( 'WP_DEBUG_LOG', '/home/username/logs/wp-debug.log' );If the host does not allow that, I block direct access to debug.log in .htaccess and delete the file as soon as I am done. I also keep file permissions tight, the same way I described in my post on WordPress file permissions.
How I read the log in WordPress debug mode
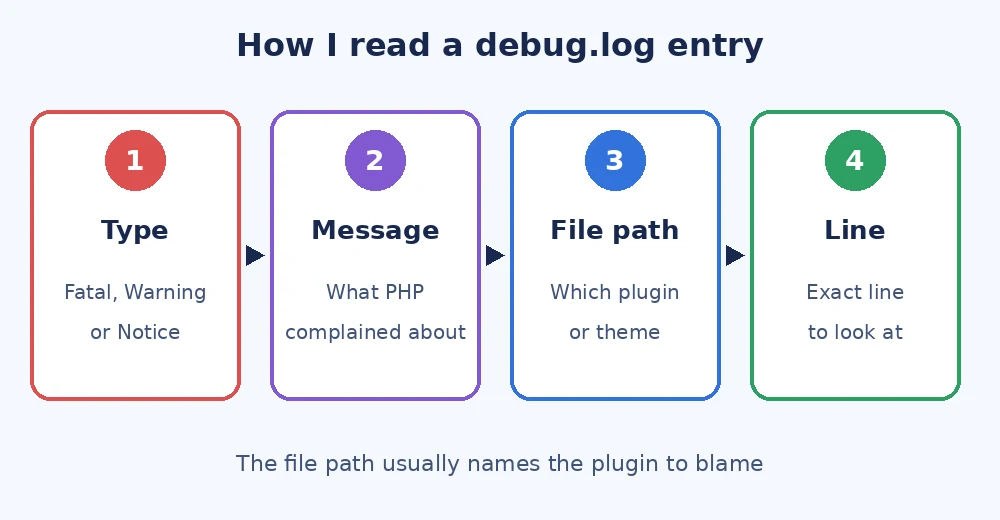
Once debug mode is on, I reproduce the problem: I load the broken page, submit the form or run the checkout. Then I open the log and go straight to the newest entries at the bottom. Each entry tells me four things: the type of error, the message, the file path and the line number.
- Fatal error: this is what actually breaks the page. I fix these first.
- Warning: something is wrong but the page still loads. Worth fixing, but rarely the cause of a crash.
- Notice and Deprecated: usually old code that still works. I note them for later updates.
The file path is the most useful part. If it points into wp-content/plugins/some-plugin/, I know which plugin to look at without testing them all. That is how I usually handle a WordPress plugin conflict or a white screen of death. If the path points to the theme, I check recent theme edits or a missing child theme function.
When I add Query Monitor
For problems that do not throw an error, such as a slow page or a hook that runs twice, the log is not enough. Then I install the free Query Monitor plugin on staging. It shows PHP errors, slow database queries, hooks and HTTP requests for the page you are on, visible only to logged-in administrators. I remove it again when the job is finished.
Turning WordPress debug mode off again
The mistake I see most often is debug mode left on for months. The log file grows to hundreds of megabytes, fills the hosting space and, if it is public, leaks server paths. When the fix is done, I set WP_DEBUG back to false, remove the extra lines, delete the log and clear the cache.
Final thoughts
WordPress debug mode turns a mystery error into a file name and a line number. Turn it on with logging enabled and display switched off, keep the log private, read the newest fatal errors first, and switch it off when you are done. If your site is showing errors and you would rather have someone find the cause for you, you can contact me and I will take a look.